
- What is Schedule/Time Planning?
- Planning Processes and Outputs for Project Schedule Management
- Activities in Plan Schedule
- Sequencing using Network Diagram: Activity on node (AON)
- Estimating the Duration of Activities
- Scheduling
What is Schedule/Time Planning?
- In scope planning, we determine the work that needs to be delivered on the project.
- Next, we need to know what activities/tasks need to execute, how much time reach would take, in what sequence they would be carried out, and by how many resources.
- All these questions are answered in schedule/time planning.
- The main planning tasks performed include planning schedule management, defining activities, sequencing activities, estimating activity durations, and developing the project schedule.
- The main documents produced are a schedule management plan, an activity list and attributes, a milestone list, a project schedule network diagram, activity duration estimates, a schedule baseline, a project schedule, and project calendar.
Planning Processes and Outputs for Project Schedule Management
| Knowledge area | Planning process | Outputs |
|---|---|---|
| Project schedule management | Plan schedule management Define activities Sequence activities Estimate activity durations Develop schedule |
Schedule management plan Activity list Activity attributes Milestone list Change requests Project schedule network diagrams Activity duration estimates Basis of estimates Schedule baseline Project schedule Schedule data Project calendars |
Activities in Plan Schedule
Identification of Activities
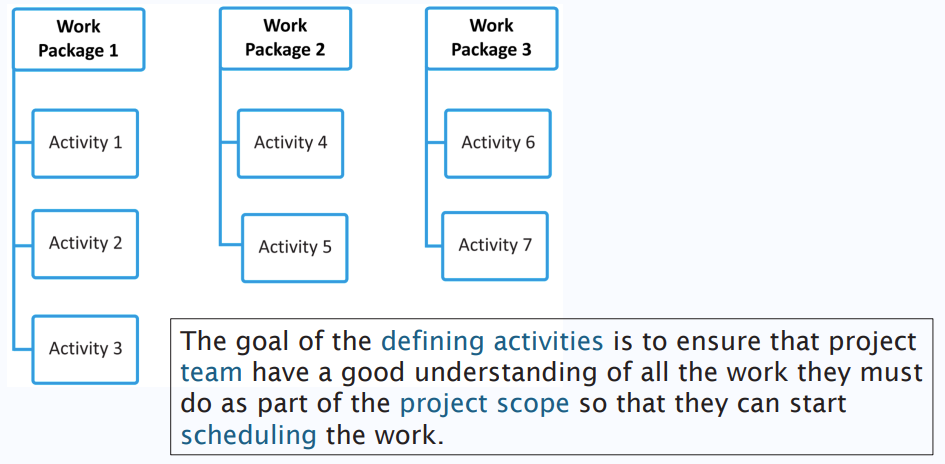
- A WBS ends with work packages. These are the smallest pieces of deliverables on a project.
- In Schedule Planning, we start with the work packages and identify the tasks/activities that need to be performed to deliver the work packages.
- The difference between a work package and activity is that the prior is an output, while the latter is an action performed by the project team members.
- An activity is a distinct, scheduled portion of work performed during the course of a project.
For example:
- If we make a WBS for a home interior project, one of the work packages would be the dining table in the house.
- This is a deliverable, as the dining table would be delivered to the customer.
- In order to make the dining table, the project team would need to procure wood, cut it to size, and assemble it. These would make the activities.
- This means that there would be one more level of decomposition below the WBS as shown below. This level will include the project activities.
Sequencing Activities
- Once the activities have been identified, they need to be put in the sequence they should occur.
- In this process, we may realise that some activities are dependent while others are independent.
- This will give us an idea on which activity can happen first, what happens next, and what can happen in parallel. Questions to consider:
- Does a certain activity have to be finished before another one can start?
- Can the project team do several activities in parallel?
- Can some activities overlap?
- Sequencing activities has a significant impact on developing and managing a project schedule.
For example:
- Let’s assume that we’ve identified seven activities to be part of our project.
- We consider only seven for the sake of simplicity.
- The seven activities are - 1 through 7.
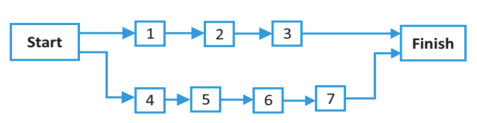
- From our understanding of the project requirements, we realize that activities 1 and 4 are independent and can be started as soon as the project starts.
- Activity 2 depends on 1 and can only happen after 1 is completed.
- Activity 3 can only happen after activity 2 has completed.
- Similarly, Activity 5 depends on 4. Activity 6 depends on 5. Activity 7 depends on 6.
 Network Diagram
Project Schedule Network Diagram
- The diagram shown above is called a Network Diagram.
- The Network Diagram shows activity dependencies in a project.
- Each node (box) shows an activity, and each arrow shows a dependency.
- The dependencies can be of various types.
- None of the elements from WBS will directly appear in the Network Diagram.
- However, the activities appearing in the Network Diagram are linked to the work packages in WBS.
Types of Dependencies:
- Mandatory dependencies are inherent in the nature of the work being performed on a project
- For example, you cannot hold training classes until the training materials are ready
- Discretionary dependencies are defined by the project team
- A project team might follow good practice and not start detailed design work until key stakeholders sign off on all the analysis work.
- External dependencies involve relationships between project and non-project activities
- For example, the installation of new software might depend on delivery of new hardware from an external supplier.
- Even though the delivery of the new hardware might not be in the scope of the project, it should have an external dependency added to it because late delivery will affect the project schedule
- Internal dependencies are within the project team’s control.
- For example, testing a machine that must be first assembled, where all the work is done inside the team.
Activity Attributes
- Along with the activities, we also need to document some details about each activity, like we did for a work package in the WBS dictionary.
- This description is kept in Activity Attributes.
- These attributes contain all the details that need to be documented for the activities for better understanding during execution.
Creating the Activity List and Attributes
- The activity list is a tabulation of activities to be included on a project schedule
- It should include the activity name, an activity identifier or number, and a brief description of the activity
- The activity attributes provide schedule-related information about each activity, such as predecessors, successors, logical relationships, leads and lags, resource requirements, constraints, imposed dates, and assumptions related to the activity
- Both activity list and activity attributes should be in agreement with the WBS and WBS dictionary and be reviewed by key project stakeholders.
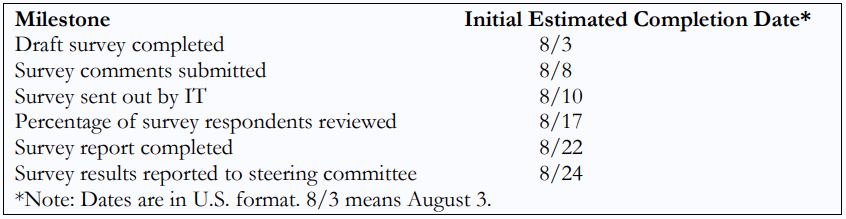
Milestone List
- A milestone is a significant point or event in a project
- It often takes several activities and a lot of work to complete a milestone, but the milestone itself is like a marker to help identify necessary activities
- There is usually no cost or duration for a milestone
- Project sponsors and senior managers often focus on major milestones when reviewing projects
- Sample milestones for many projects include:
- Sign-off of key documents
- Completion of specific products
- Completion of important process-related work, such as awarding a contract to a supplier
 Example of Milestone List
Best Practice of Milestones List
The SMART criteria suggest that milestones should be:
- Specific
- Measurable
- Assignable
- Realistic
- Time-framed
You can also use milestones to help reduce schedule risk by following these best practices:
- Define milestones early in the project and include them in the Gantt chart to provide a visual guide
- Keep milestones small and frequent
- The set of milestones must be all-encompassing
- Each milestone must be binary, meaning it is either complete or incomplete
- Carefully monitor the milestones on the critical path
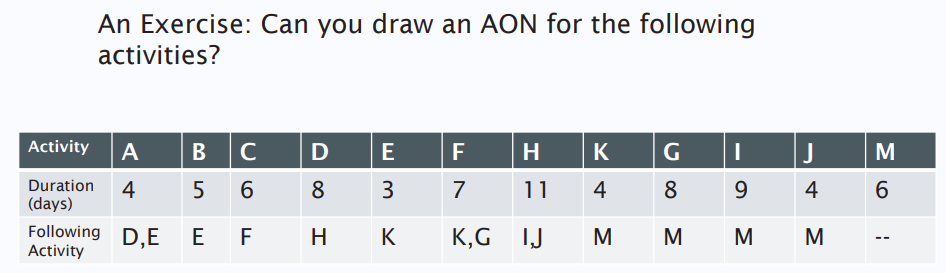
Sequencing using Network Diagram: Activity on node (AON)
- AON is a network diagramming technique in which boxes represent activities.
- This approach is more widely used as it can show all dependency types.
AON Rules
- Networks typically flow from left to right.
- An activity cannot begin until all of its preceding activities are complete.
- Arrows indicate precedence and can cross over each other.
- Identify each activity with a unique identifier; this identifier must increment(1.2.3, A,B,C, etc.) as the network proceeds.
- Looping is not allowed.
- Conditional statements are not allowed.
- Use start and stop nodes.
Terminology of AON
- Activity: An Element of project that requires time to complete.
- Parallel (concurrent) activities: activities than can occur independently and, if desired, at the same time.
- Merge activity: an activity has two or more preceding activities on which depends.
- Burst activity: an activity that has more than one activity immediately following it.
- Milestone: a point in time when an activity started or completed. It does not consume time.
Relation Between Activities of AON
There are four types of dependencies in an AON representing project activities. They are:
- Finish-to-start (FS): Successor activity cannot start until the predecessor activity finishes.
- Example: development of a software module can only start after the design has been completed.
- Finish-to-finish (FF): Successor activity cannot be completed until the predecessor activity has completed.
- Example: Creation of a user manual of a product can occur in parallel with its development, but it cannot be completed until the development is also complete, as there could be changes that need to be included in the manual.
- Start-to-start (SS): Successor activity cannot start until the predecessor activity starts.
- Example: The sales team can’t start selling the product until the basic product road map documentation starts.
- Start-to-finish (SF): Successor activity cannot be completed until the predecessor activity starts.
- Example: The first security guard shift (successor) cannot finish until the second security guard shift (predecessor) starts.
Lag & Lead of AON
- In a network diagram, the most commonly used dependency is F-S.
- In this dependency, the successor activity can start as soon as the predecessor activity finishes.
- However, there are instances when we need to wait between the finish of the predecessor and the start of the successor.
- This is called Lag. Lag may be found in activities with all relationship types (F-S, S-S, F-F and S-F)
- There are times when we can start an activity a little ahead of its predecessor’s finish by taking a little higher risk in an F-S dependency.
- This is called Lead and is exactly opposite of Lag. Lead is only found in F-S relationships
- Sometimes in scheduling tools, like Microsoft Project, it is called negative Lag.
Example of Lead & Lag:
- The photo shoot will take four days, and the photo editing will take six days. Instead of waiting until the end of the 4-day photo shoot to begin editing the pictures, we start editing after the first day of shooting.
- This brings the total duration from ten days down to seven days by leveraging the lead.
- The photo proofs are sent to the customer upon completion of the shoot; however, there is a 15-day lag associated with the customer review before the printing of the photos can begin.
Estimating the Duration of Activities
- Once we have identified the activities and their sequences, we need to know their duration to set calendar dates.
- Activity duration depends on two things: effort and resources.
- Effort is the “man-days” or “man-hours” to complete an activity.
- Resources is the number of work units required to complete the activity.
- After estimating the effort required, the duration can be computed based on the number of resources working on the activity.
- For example, if the effort is 8-man hours
- Then the duration would be 1 day if one resource works on the activity.
- And the duration will be about 0.5 days if two resources work on it and so on.
Effort Estimation
Duration = Effort / Number of Resources
- The key inputs required for effort estimation will come from historical data, subject-matter experts, and the team members performing the activity.
- Effort estimates are often provided as discrete estimates, such as 8 hours, 80 hours, and so on.
Parametric Estimate
Parametric Estimate = Thumb Rule per unit ☓ Number of Unit
- This is called a Parametric Estimate and is generally the most accurate because the thumb rule is made using data from past projects and expert judgement.
- In software development projects, we regularly use Function Point (FP) based estimation.
- In this technique, we calculate the number of function points and use a standard productivity chart to arrive at the final “man days” estimate of activities.
PERT (Program Evaluation & Review Technique)
- In the previous estimation, we used historical data from past projects and/or expert judgement to arrive at an estimate.
- This is only possible when such work has been performed in the past.
- If the activity is totally new or differs enough from the one done in the past, then we may not be able to produce an accurate figure for the effort estimation.
- In such cases, we can use PERT.
- PERT also can be used when there is a high degree of uncertainty
- This technique suggests the use of three estimates: Optimistic (O), Most Likely (M) and Pessimistic (P).
- An Optimistic estimate is an estimate of the earliest possible completion duration of an activity.
- A Pessimistic estimate is an estimate of the latest possible completion duration of an activity.
- A Most Likely estimate is an estimate of the most probable completion date of an activity.
PERT Estimate = (O + 4M + P) / 6
- It is also called weighted average.
For example:
If an activity has the following estimates:
- 0 = 5 days
- M = 8 days
- P= 10 days
Then, PERT Estimate is:
Pert= (5 + (4x8) + 10) / 6 = 47 / 6 = 7.833 days
Risk Factor of PERT Estimate
- When using a PERT estimate, we are also interested in knowing how much risk is involved in the activity’s estimate.
- That determines the probability of completing the project on time.
- This is done by calculating the Standard Deviation of a PERT estimate.
- The Formula for calculating standard deviation is given below:
Standard Deviation = (P - O) / 6
- In the above example, the Standard Deviation = (10 - 5) / 6 = 5 / 6 = 0.833
- It means that the activity can be completed within 7.833 +/- 0.833 days or anywhere between 7 and 8.666 days
Scheduling
- So far, we have the activities, their dependencies and durations.
- Now it is possible to set calendar dates and finalize the project schedule.
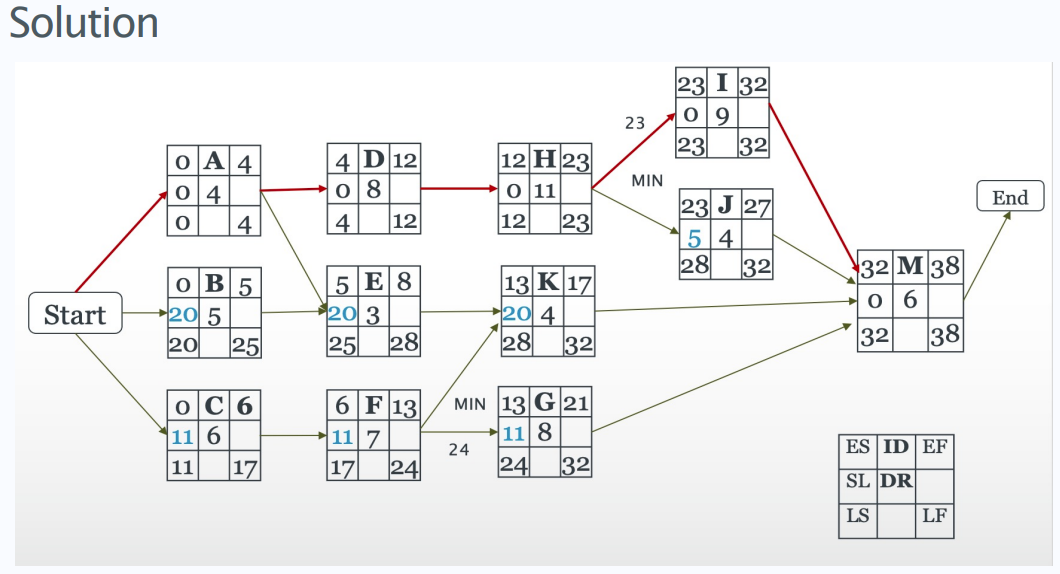
Critical Path of Scheduling
- A critical path is the longest path in the project’s network diagram that dictates how long a project would take.
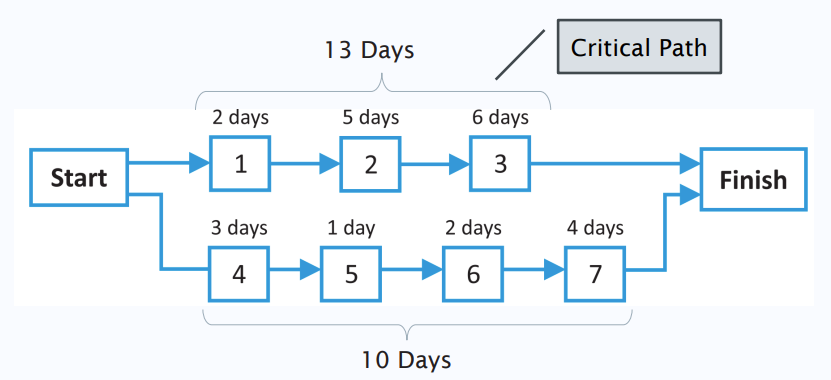
- It also tells a project manager which activities are on the critical path, and that he or she has to spend more monitoring and controlling time on these activities.
- In the above diagram, the project manager’s time is best spent on monitoring activities 1, 2 and 3 as any delay in these activities would delay the project.
- Activities on the critical path cannot be delayed without delaying the entire project.
- Hence, they do not have any “float” or “slack”, or the “float” or “slack” is zero.
- A project can have multiple critical paths.
- That would increase the risk of the project because the project manager now needs to worry about multiple paths that could possibly delay the project.
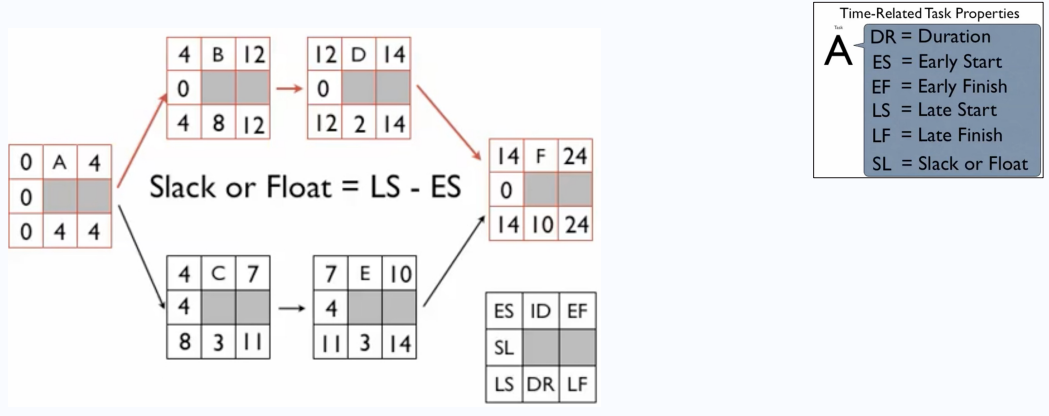
Float and Slack
- Float and Slack are two terms that measure the amount of flexibility or buffer time that an activity has in a project schedule.
- They indicate how much an activity can be delayed or extended without affecting the project completion date or the start of another activity.
- Float and Slack are often used interchangeably, but they have some subtle differences.
- Float is usually applied to the whole project or a path of activities, while Slack is applied to a single activity or a pair of activities.
- Calculating float and slack can help you optimise your project schedule and resources.
- By knowing the float and Slack of each task, you can prioritise the critical tasks that have no or low float and slack
- Manage the expectations of your stakeholders.
- Adjust the non-critical tasks that have high float and slack.
Calculating Float and Slack Using a Network Diagram
- The forward pass calculates the earliest start and finish dates of each task, starting from the project start date.
- The backward pass calculates the latest start and finish dates of each task, starting from the project end date.
- The difference between the earliest and latest dates is the float or slack of each task.
Example:
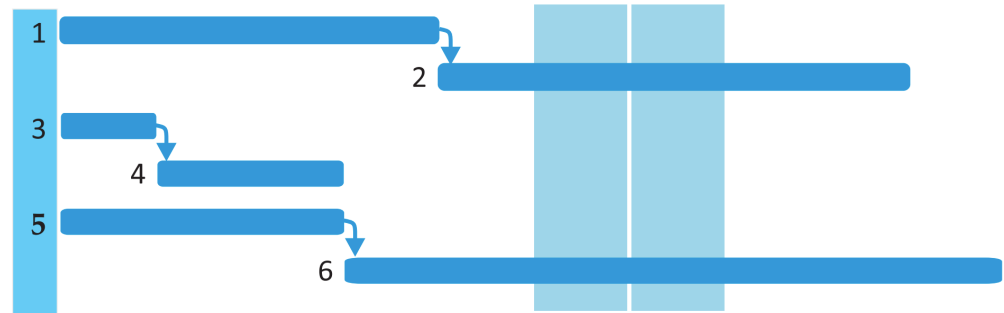
Using a Gantt Chart for Showing the Project Schedule
The difference between a Gantt chart and a network diagram is that the bars in Gantt chart change in length based on the activity duration and we can show progress using a Gantt chart.
Schedule Compression
If the developed schedule does not fit within the expected timelines, we need to compress the schedule. There are two primary ways of doing this:
- Crashing – One way to compress the schedule is by increasing the resources working on the critical path activities.
- These resources can either be picked up from the non-critical activities or they could be hired from outside the project.
- This action generally increases the project costs and is called Crashing.
- Fast Tracking – If there is a possibility of removing some discretionary dependencies and doing some activities in parallel, it is called Fast Tracking.
- This leads to higher risks in the project as there is a possibility of rework because some dependencies have been removed.
